1.8 Venn Diagrams - Sets - Class 11 Mathematics
1.8 Venn Diagrams
NCERT Class 11 Mathematics for blind and visually impaired students made screen readable by Professor T K Bansal.
Most of the relationships between sets, can be represented by means of diagrams, which are known as Venn diagrams. Venn diagrams are named after the English logician, John Venn (1,834-1,883). These diagrams consist of rectangles and closed curves usually circles. The universal set is represented usually by a rectangle and its subsets by circles.
In a Venn diagram, the elements of the sets are written in their respective circles (Figures 1.2 and 1.3)
Figure 1.2
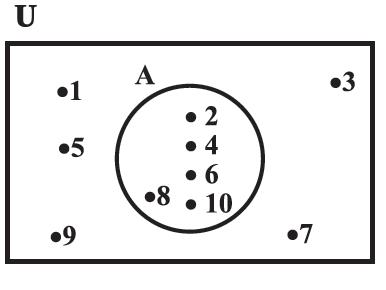
Illustration 1
In Figure 1.2, U = {1, 2, 3, ..., 10} is the universal set of which A = {2, 4, 6, 8, 10} is a subset of the universal set.
Figure 1.3
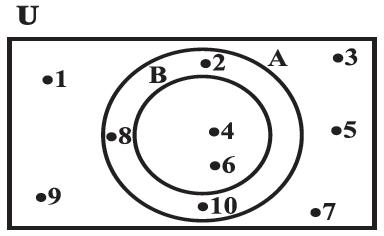
Illustration 2
In Figure 1.3, U = {1, 2, 3, ..., 10} is the universal set of which A = {2, 4, 6, 8, 10} and B = {4, 6} are subsets, and also B ⊂ A.
The reader will see an extensive use of the Venn diagrams when we will discuss the union, intersection and difference of sets.